
Diagrams are powerful visual tools that simplify the presentation of complex data, making it more accessible and understandable. Among these tools, Euler diagrams and Venn diagrams are widely recognized for their ability to illustrate relationships between datasets. Although they may appear similar at first glance, each serves a distinct purpose and has unique characteristics.
In this post, we’ll dive into the details of Euler diagrams and Venn diagrams. We’ll define each diagram, explain their differences, provide examples, and discuss scenarios where a Euler diagram might be more appropriate than a Venn diagram.
What is a Euler Diagram?
A Euler diagram, named after the Swiss mathematician Leonhard Euler, is designed to visually represent the relationships between sets. Unlike Venn diagrams, which always show all possible overlaps between sets, Euler diagrams focus only on the intersections that actually exist. This makes them particularly useful for representing real-world data with more precision.
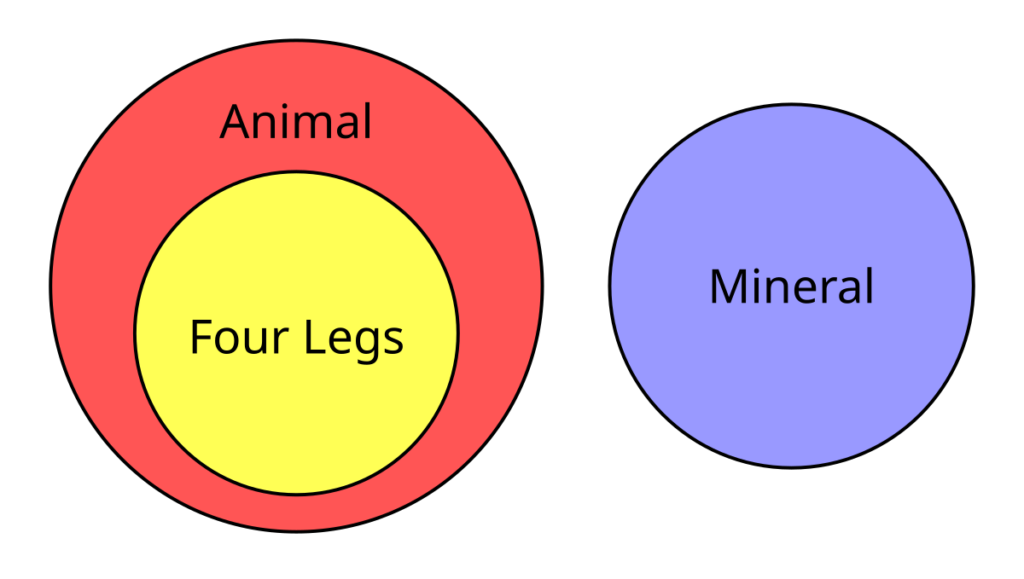
For instance, while dogs, cats, and deer are all mammals, reptiles form a disjointed set with no overlap, as they share no common members with mammals. Euler diagrams can handle such disjointed sets effectively, making them ideal for illustrating complex, real-world relationships.
What is a Venn Diagram?
Venn diagrams, introduced by English logician John Venn, also depict relationships between datasets but differ from Euler diagrams in their approach. Venn diagrams represent all possible intersections between sets, even if some of those intersections are empty.
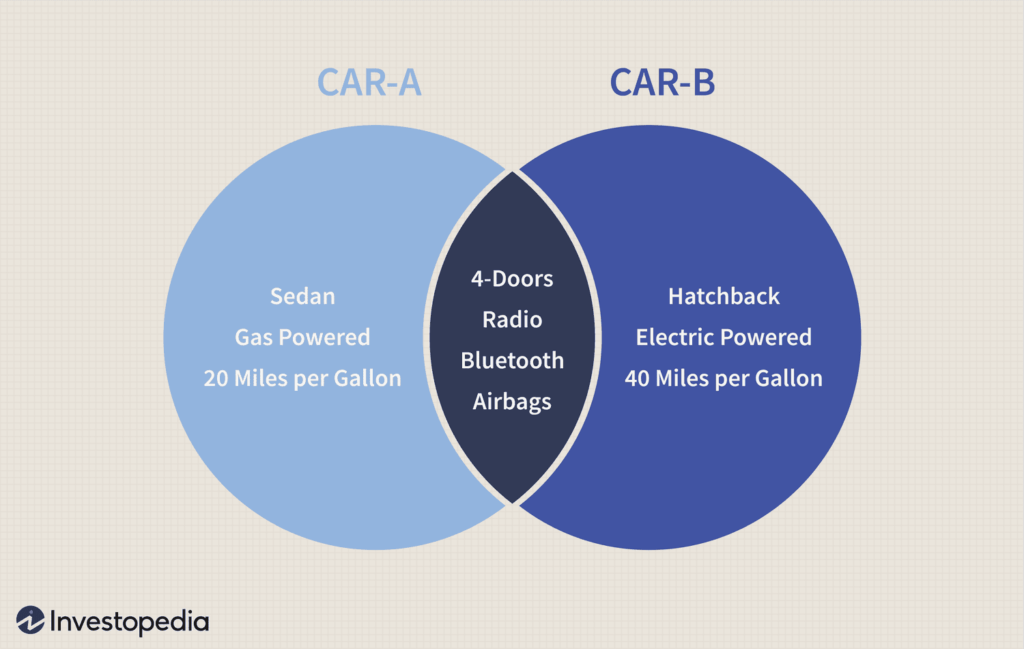
This makes them a comprehensive tool for analyzing the full range of potential relationships, though they can become cumbersome with more than three sets due to increased complexity.
Differences Between Euler Diagrams and Venn Diagrams
While both diagrams are useful, they differ in several key areas, including purpose, overlap, complexity, and visual structure.
- Purpose and Completeness: Euler diagrams emphasize clarity by displaying only relevant intersections, while Venn diagrams prioritize completeness by showing all possible relationships, including those with no elements.
- Overlap: In Venn diagrams, overlapping regions represent shared relationships, even when these overlaps are empty. In contrast, Euler diagrams only show overlaps when they are relevant and exist in reality.
- Complexity: Euler diagrams are more versatile, easily handling complex relationships involving multiple sets. Venn diagrams are generally more suited for simpler comparisons between two or three sets.
- Visual Structure: Venn diagrams always intersect, regardless of relevance, while Euler diagrams allow for non-overlapping, disjointed sets.
When to Use a Euler Diagram vs. a Venn Diagram
While Venn diagrams are excellent for exploring relationships in fields like mathematics, logic, and education, Euler diagrams are better suited for analyzing more complex relationships, such as:
- Complex Relationships and Hierarchies: Euler diagrams can clarify intricate relationships and handle disjointed sets more effectively.
- Overlapping Definitions: They can highlight common elements across multiple datasets without unnecessary complexity.
- Software Engineering: Euler diagrams can map out relationships within data architecture, algorithms, and application modules.
- Logical Reasoning: They help visualize logical relationships between arguments and propositions.
- Database Management: Euler diagrams can depict intersections among various database entities and attributes.
How to Create a Euler Diagram
Creating a Euler diagram can be easily done using a diagramming tool like Ideogram. Start from Ideogram Templates. Digital diagrams are easier to modify than hand-drawn ones, especially as you refine your understanding of the data. Start by outlining your data statements, then draw and modify your diagram step by step, ensuring that each circle or shape accurately reflects the relationships described by your data.
By understanding the differences between Euler and Venn diagrams, you can choose the most appropriate tool for your specific needs, ensuring clarity and precision in your visual representations of data.
Read other articles: